
Ksyusha Bespalova
Product version
15.04.21
Date
1 year ago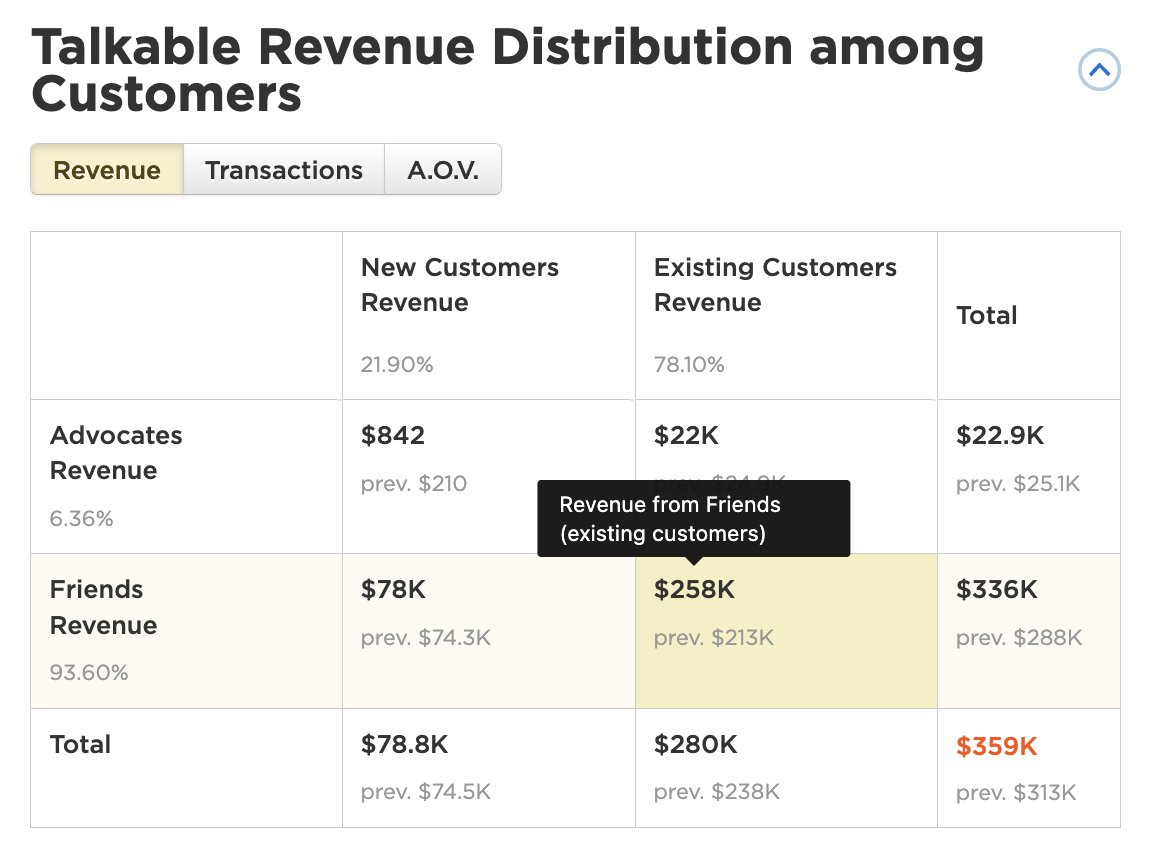
We’ve listened to your feedback and made big improvements to the “Talkable Transactions Distribution among Customers” tile on your dashboard. Our updated design focuses on clarity and transparency.
Here’s what’s new:
- Each key metric — including AOV — now comes with a helpful tooltip that explains exactly how it’s calculated
- The redesigned layout makes it easier to interpret revenue distribution at a glance
This redesign isn’t just cosmetic — it’s aimed at helping you make smarter, faster decisions with better data. Whether you’re analyzing customer spend or tracking referral campaign success, you’ll now have a much clearer view of how your revenue is distributed among customers.
Date
Posted 1 year ago