“What gets measured gets done,
what gets measured and fed back gets done well,
what gets rewarded gets repeated.”
– John E. Jones II
How to Measure Referral Marketing Success Without Drowning in Data
Measuring the success of your referral program can feel like standing in front of a whiteboard filled with metrics, wondering which ones actually mean something. You’re not alone. Referral programs are powerful, but without the right measurement strategy, even the best ideas get lost in a spreadsheet.
The reality is, you don’t need to track everything. You just need to focus on the numbers that reflect actual performance. Companies that actively track and improve their referral programs see a huge lift compared with those who don’t, and it starts with understanding what to measure and why.
This post covers the key metrics that matter, and more importantly, how to take action based on what you learn:
Focus Your Dashboard
Start with a core set of metrics. These are the ones that give you the clearest view of how your program is performing:
Participation Rate
Conversion Rate
Cost Per Referral
Customer Lifetime Value
Social Sharing Impact
Referral Velocity
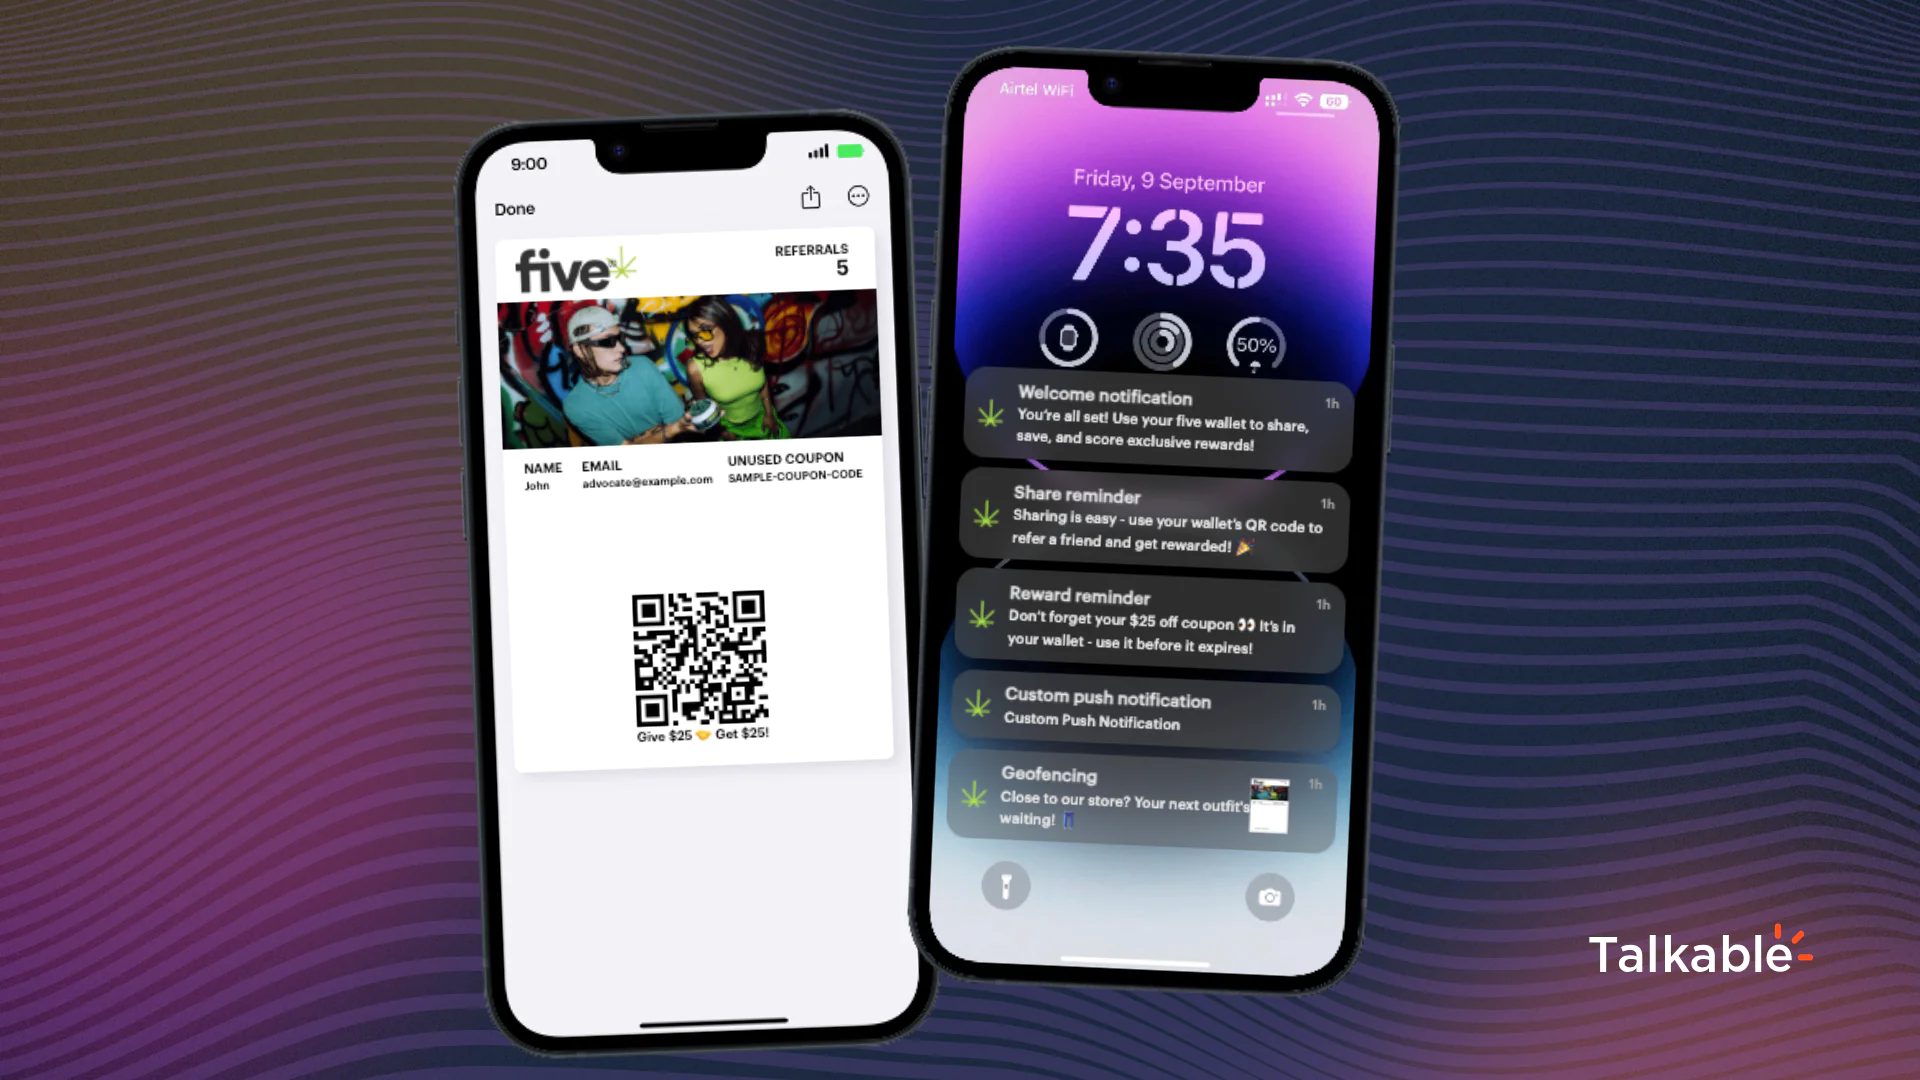
Mobile Engagement
Resist the urge to track everything all at once. You’re better off making real improvements in a few areas than spinning your wheels trying to move all the needles at the same time.
1. Participation Rate
If no one joins, nothing else matters. Participation is the heartbeat of any referral program. Top-performing programs typically see 15 to 20 percent of customers participating.
A strong participation rate shows that your customers are engaged and willing to advocate for your brand. If you’re falling short of that 15 percent mark, it’s likely an issue of awareness or friction in the signup process.
Formula:
Participation Rate = (Number of Participants ÷ Total Eligible Customers) × 100Example:
If 2,000 customers out of 10,000 eligible ones refer someone:
(2,000 ÷ 10,000) × 100 = 20%
How to increase participation rate:
- Promote the program across every touchpoint, from transactional emails to post-purchase pages
- Make signup effortless, ideally under 30 seconds
- Offer rewards that actually matter to your customers, not just what’s easy to fulfill
2. Conversion Rate
It’s one thing to get people sharing. It’s another to turn those shares into revenue. Conversion rate tells you how often a referred friend becomes a customer.
Referred customers convert three to five times better than cold leads. That’s because referrals come pre-loaded with trust. But even trust needs a well-designed funnel.
Formula:
Conversion Rate = (Referred Conversions ÷ Total Referral Clicks or Invites) × 100Example:
If you had 500 referral clicks and 75 new customers signed up:
(75 ÷ 500) × 100 = 15%
Ways to improve conversion:
- Build dedicated landing pages for referred traffic that reinforce social proof and relevance
- Test reward structures to see what drives urgency
- Eliminate any extra clicks or friction in the referral journey
3. Cost Per Referral (CPR)
Referrals should be one of your most efficient acquisition channels. Referral programs typically cost 40 percent less than traditional marketing. But CPR can creep up if the program isn’t maintained.
Formula:
Cost Per Referral = Total Referral Program Cost ÷ Number of Successful ReferralsExample:
If you spent $5,000 on rewards and generated 250 successful referrals:
5,000 ÷ 250 = $20 per referral
How to keep costs low without sacrificing impact:
- Automate manual steps where possible
- Analyze which rewards lead to the highest ROI, not just the most volume
- Trim the fat from the referral flow and remove any unnecessary asks or barriers
4. Customer Lifetime Value (CLV)
Not all customers are created equal. Referred customers are worth 25 percent more over their lifetime compared to non-referred ones. That’s because people who come in through a trusted source often feel more connected and loyal from the start.
Formula (simplified):
LTV = Average Order Value × Purchase Frequency × Customer LifespanExample:
If AOV = $100, Frequency = 5/year, Lifespan = 3 years:
100 × 5 × 3 = $1,500Alternate (subscription model):
LTV = ARPU × Gross Margin × Average Customer Lifespan
To maximize lifetime value from referrals:
- Build onboarding that speaks directly to referred customers and acknowledges the connection
- Introduce loyalty perks that reward both the referrer and the new customer over time
- Keep the relationship going with timely, relevant touchpoints after the first purchase
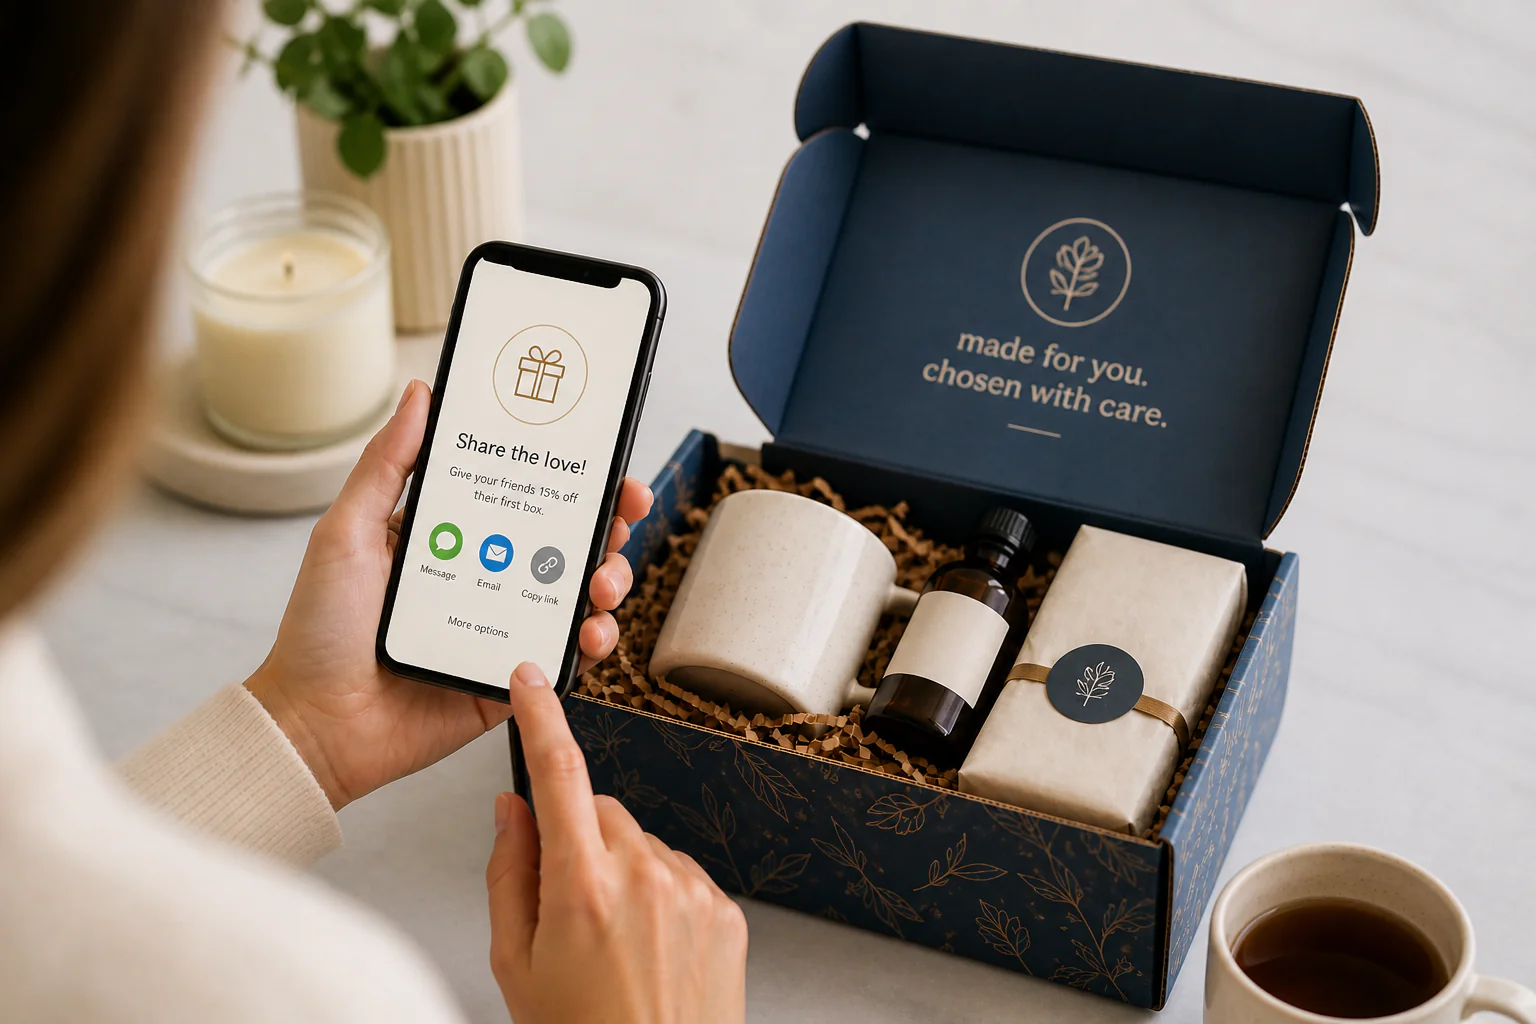
5. Social Sharing Impact
Referrals have a ripple effect. Referred customers are twice as likely to share brand content compared to others. That means each successful referral isn’t just a new customer. It’s a potential amplifier.
Formula:
Social Sharing Impact = (Referred Visitors from Social Shares ÷ Total Social Shares)Example:
If 5,000 visits came from 1,000 social shares:
5,000 ÷ 1,000 = 5 visitors per shareAlternate view (conversion-focused):
Social Referral Conversion Rate = (Conversions from Social Shares ÷ Total Social Shares) × 100If 120 conversions came from 1,000 shares:
(120 ÷ 1,000) × 100 = 12%
How to fuel that amplification:
- Provide ready-to-share content that looks good and feels personal
- Make it simple to share with one or two clicks
- Highlight how many others are referring, creating social proof and a sense of momentum
6. Referral Velocity
Timing matters. Most referral conversions happen within seven days. Wait too long and you lose momentum. Push too soon and it feels transactional.
Formula:
Referral Velocity = Number of Referrals ÷ Time (days, weeks, or months)Example:
If you generate 300 referrals in the first 30 days:
300 ÷ 30 = 10 referrals per dayAlternate (normalized):
You can normalize for cohort size:
Referral Velocity per 1,000 Customers = (Total Referrals ÷ Customer Base) × 1,000 ÷ TimeIf 300 referrals came from a base of 15,000 in 30 days:
(300 ÷ 15,000) × 1,000 ÷ 30 = 0.67 per 1,000 customers per day
How to optimize velocity:
- Follow up with both parties quickly after a referral is initiated
- Use limited-time rewards to create urgency
- Reduce delays across each step of the process, from invite to conversion
7. Mobile Engagement
Referrals are no longer happening at desktop workstations. Deloitte reports that 65 percent of referrals now happen on mobile. If your program isn’t built for that reality, you’re leaving money on the table.
Formula:
Mobile Engagement Rate = (Mobile Referral Shares or Interactions ÷ Total Referral Interactions) × 100Example:
If 600 of 1,000 total shares came from mobile:
(600 ÷ 1,000) × 100 = 60%
Mobile-friendly tactics:
- Use responsive design and fast-loading pages
- Limit the number of form fields to only what’s essential
- Make sure the sharing and claiming experience is smooth on every mobile device
Avoid These Common Pitfalls
When in doubt, dig deeper. Numbers without context can be misleading. A few traps that teams fall into when tracking referral success:
- Getting distracted by vanity metrics like shares without conversions
- Failing to collect feedback from both participants and non-participants
- Misreading seasonal spikes or dips without putting them in context
Try These Next Steps
Companies who follow a deliberate optimization process see 43 percent better results. Not because they guessed right the first time, but because they kept iterating. If you’re just starting out or looking to level up your referral program, here’s a clear path forward:
- Choose three key metrics to focus on for the next quarter
- Set up reliable tracking and dashboards
- Run small experiments to test improvements
- Review the results and refine regularly
Make Some Data Visualizations That Actually Help
Make sure your data team builds these with your business questions in mind, not just the tools they have on hand. Bring your data to life with the right visuals. These should be built to answer real questions, not just fill up a slide:
- A referral funnel that shows drop-offs at each stage
- A time-based graph of participation trends
- A comparison of cost per acquisition across channels
- A chart showing how referred customers share content
- A mobile versus desktop usage split to guide UX decisions
About the Author:
Jeremy Foreshew is a full-stack marketer with deep expertise in customer-led growth. As Head of Marketing at Talkable, he helps DTC and eCommerce brands turn their customers into their most powerful acquisition channel. Jeremy writes about referral strategy, retention, and the future of word-of-mouth marketing. He has been featured in Forbes, TechCrunch, and HuffPost.